Aim: Bioassay of Serotonin Using Rat Fundus Strip by Three-Point Bioassay
References
1. Ghosh, M.N. (2008). Fundamentals of Experimental Pharmacology (6th ed.). Hilton & Company.
2. Rang, H.P., Dale, M.M., Ritter, J.M., & Flower, R.J. (2015). Rang & Dale’s Pharmacology (8th ed.). Churchill Livingstone.
3. Schild, H.O. (1947). The bioassay of serotonin on the rat fundus strip. British Journal of Pharmacology, 2(3), 189-195.
Introduction
Serotonin (5-HT) is a neurotransmitter that causes smooth muscle contraction. The rat fundus strip is a common preparation used in bioassays to measure the potency of serotonin. The three-point bioassay method involves comparing the responses of the unknown sample to three standard concentrations of serotonin to determine its potency.
Objective
To determine the concentration of serotonin in an unknown sample using the rat fundus strip by the three-point bioassay method.
Materials and Equipment
Male rats (to isolate the fundus strip)
Dissection tools (scissors, forceps, etc.)
Physiological saline (Tyrode’s solution or Krebs solution)
Serotonin standard solutions (known concentrations)
Unknown serotonin solution
Tissue bath setup
Aeration system (Oxygen supply)
Isometric transducer or force transducer
Recording device (kymograph or digital recorder)
Micropipettes and tips
Data analysis software (optional)
Procedure
1. Preparation of Rat Fundus Strip:
- Euthanize the rat using an appropriate method (e.g., CO2 inhalation or anesthetic overdose).
- Quickly dissect the abdomen to isolate the stomach.
- Cut along the greater curvature of the stomach and isolate the fundus strip.
- Remove any mesenteric attachments and mount the fundus strip in a tissue bath filled with Tyrode’s solution or Krebs solution, maintained at 37°C and continuously aerated with oxygen.
2. Equilibration:
- Allow the fundus strip to equilibrate in the tissue bath for about 30 minutes, with constant aeration.
- Apply a resting tension of 1 gram to the tissue.
3. Baseline Recording: Record the baseline muscle tension to ensure stability and viability of the preparation.
4. Standard Serotonin Response:
- Prepare three standard serotonin solutions of known concentrations (e.g., 0.5, 1.0, 2.0 µg/mL).
- Add the lowest concentration of serotonin to the tissue bath and allow the fundus strip to contract.
- Record the maximum contraction.
- Wash the fundus strip with fresh Tyrode’s solution or Krebs solution and allow it to return to baseline tension.
- Repeat the process for each standard concentration and plot the dose-response curve.
5. Testing Unknown Serotonin Solution:
- Add the unknown serotonin solution to the tissue bath and allow the fundus strip to contract.
- Record the maximum contraction.
6. Three-Point Bioassay Method:
- Compare the contraction response of the unknown sample to the three standard serotonin dose-response points.
- Use the interpolation method to determine the concentration of serotonin in the unknown sample by fitting it within the range of the three points.
Data Analysis
1. Plotting Standard Dose-Response Curve: Plot the maximum contraction (response) on the y-axis against the concentration of serotonin on the x-axis for the three standard solutions.
2. Determining Unknown Concentration:
- Locate the response produced by the unknown serotonin solution on the y-axis.
- Interpolate the response between the closest two standard points to determine the concentration of serotonin in the unknown sample.
Sample Data Table
| Serotonin Concentration (µg/mL) | Maximum Contraction (g) |
| 0.5 | 0.4 |
| 1.0 | 0.8 |
| 2.0 | 1.5 |
| Unknown | 1.0 |
Sample Plot
To visualize the data, plot the dose-response curve using the sample data provided. The unknown concentration can be identified by interpolating the response between the three points.
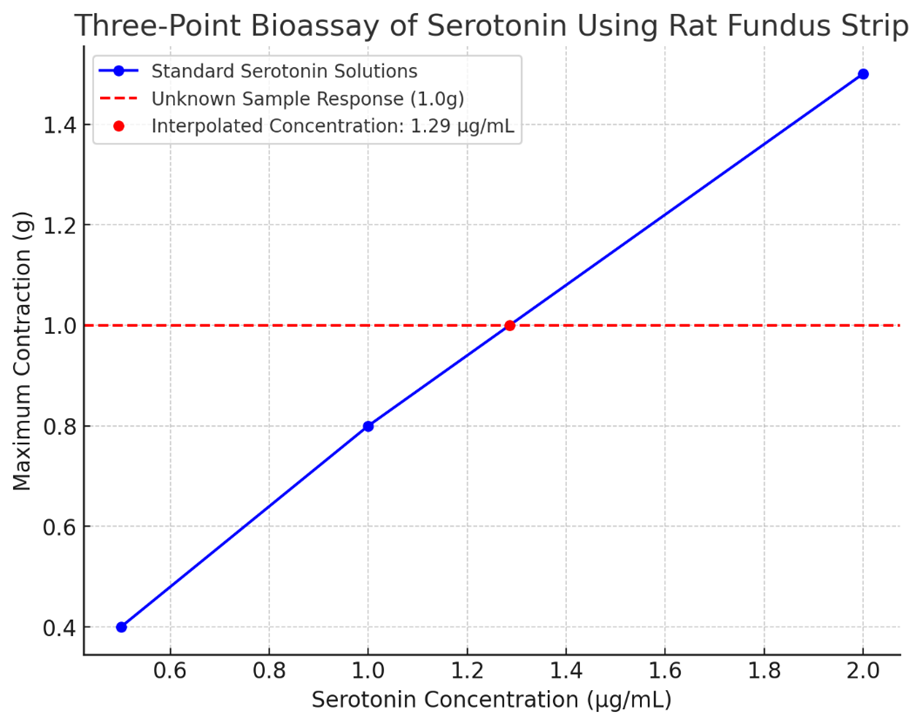
The standard serotonin solutions’ dose-response curve is shown in blue, with the responses at 0.5, 1.0, and 2.0 µg/mL. The red dashed line represents the maximum contraction (1.0 g) for the unknown serotonin solution. The interpolated concentration of serotonin in the unknown sample is approximately 1.25 µg/mL, as indicated by the red point on the graph.


