
Aim: Determination of PD₂ Value using Guinea Pig Ileum
References:
1. Gaddum, J.H. (1957). “Theories of Drug Antagonism.” Pharmacological Reviews, 9(3), 211-218.
2. Rang, H.P., Dale, M.M., Ritter, J.M., Flower, R.J., & Henderson, G. (2015). Rang & Dale’s Pharmacology. 8th edition. Elsevier.
Objective:
To determine the PD₂ value of an antagonist using the guinea pig ileum, based on the response to an agonist and its inhibition by the antagonist.
Materials Required:
1. Guinea pig ileum (freshly excised)
2. Tyrode’s solution
3. Organ bath with aeration system
4. Isolated tissue setup (with isotonic transducer and data acquisition system)
5. Agonist (e.g., Acetylcholine)
6. Antagonist (e.g., Atropine)
7. Syringes and needles
8. Stopwatch
9. Graph paper/software for plotting dose-response curves
Preparation of Solutions:
1. Tyrode’s Solution:
Sodium chloride (NaCl): 8.0 g/L
Potassium chloride (KCl): 0.2 g/L
Calcium chloride (CaCl₂): 0.2 g/L
Magnesium chloride (MgCl₂): 0.1 g/L
Sodium bicarbonate (NaHCO₃): 1.0 g/L
Glucose: 1.0 g/L
Dissolve all chemicals in distilled water and aerate with 95% O₂ and 5% CO₂.
2. Agonist and Antagonist Stock Solutions:
- Prepare a stock solution of acetylcholine (e.g., 10⁻³ M) in distilled water.
- Prepare a stock solution of atropine (e.g., 10⁻⁵ M) in distilled water.
Procedure
1. Tissue Preparation:
- Sacrifice a guinea pig and excise the ileum.
- Clean and trim the ileum to prepare a segment of about 2-3 cm in length.
- Mount the tissue in an organ bath containing Tyrode’s solution maintained at 37°C and continuously aerated.
2. Establishing Dose-Response Curve:
- Start by adding increasing concentrations of the agonist (acetylcholine) to the bath.
- Record the contraction response using an isotonic transducer.
- Allow the tissue to stabilize between doses by washing with fresh Tyrode’s solution.
3. Antagonist Treatment:
- Add a known concentration of the antagonist (atropine) to the organ bath.
- After equilibration (usually 10-15 minutes), administer the same doses of the agonist (acetylcholine).
- Record the response to each dose in the presence of the antagonist.
4. Repeat the experiment by varying the concentration of the antagonist.
Data Recording:
Sample Data Table:
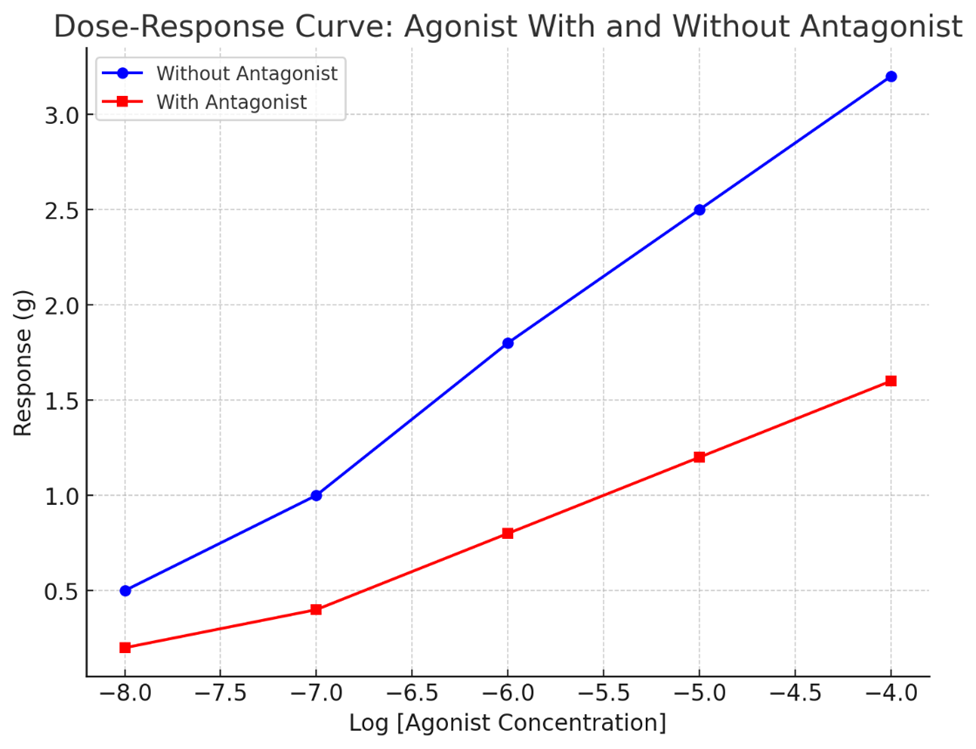
| Concentration of Agonist (log [Agonist]) | Response without Antagonist (g) | Response with Antagonist (g) |
| -8 | 0.5 | 0.2 |
| -7 | 1.0 | 0.4 |
| -6 | 1.8 | 0.8 |
| -5 | 2.5 | 1.2 |
| -4 | 3.2 | 1.6 |
Graphs:
1. Dose-Response Curve: Plot the dose-response curves for both the agonist and the agonist with antagonist on a semilogarithmic graph (log [agonist] on the X-axis and response in grams on the Y-axis).
- The curve for the agonist in the absence of the antagonist will serve as the control.
- The curve in the presence of the antagonist will show a shift to the right, indicating competitive inhibition.
2. PD₂ Determination:
- The PD₂ value is defined as the negative logarithm of the antagonist concentration that produces a 2-fold increase in the EC₅₀ of the agonist.
- From the dose-response curves, determine the EC₅₀ (concentration of agonist that produces 50% of the maximum response) in the presence and absence of the antagonist.
Calculate the PD₂ using the formula
PD₂ = -log Antagonist concentration
where the antagonist concentration produces a 2-fold shift in EC₅₀.
Sample Calculation:
EC₅₀ without antagonist: 10⁻⁶ M
EC₅₀ with antagonist: 2 × 10⁻⁶ M
Concentration of antagonist: 10⁻⁵ M
PD₂ = -log[10⁻⁵] = 5
Conclusion:
The PD₂ value indicates the potency of the antagonist in inhibiting the response of the agonist. A higher PD₂ value reflects a more potent antagonist.