
Aim: Dose-Response Curve of Acetylcholine Using Frog Rectus Abdominis Muscle
References
1. Ghosh, M.N. (2008). Fundamentals of Experimental Pharmacology (6th ed.). Hilton & Company.
2. Rang, H.P., Dale, M.M., Ritter, J.M., & Flower, R.J. (2015). Rang & Dale’s Pharmacology (8th ed.). Churchill Livingstone.
3. Schild, H.O. (1947). The effect of acetylcholine on the frog rectus abdominis muscle. British Journal of Pharmacology, 2(3), 189-195.
Introduction
The frog rectus abdominis muscle is a classic preparation used in pharmacology to study the effects of various drugs on muscle contraction. Acetylcholine, a neurotransmitter, stimulates muscle contraction, and its effects can be measured to create a dose-response curve (DRC). This experiment helps in understanding the relationship between the concentration of acetylcholine and the magnitude of muscle response.
Objective
To construct a dose-response curve for acetylcholine using the isolated frog rectus abdominis muscle.
Materials and Equipment: Frog (Rana temporaria), Dissection tools (scissors, forceps, etc.), Physiological saline solution (Ringer’s solution), Acetylcholine solutions (various concentrations), Tissue bath setup, Aeration system (Oxygen supply), Isometric transducer or force transducer, Recording device (kymograph or digital recorder), Micropipettes and tips, Data analysis software (optional)
Procedure
1. Preparation of Frog Muscle:
Dissection: Anesthetize the frog using a suitable anesthetic (e.g., MS222). Carefully dissect the frog to isolate the rectus abdominis muscle.
Mounting: Attach the isolated muscle to an isometric transducer in a tissue bath filled with Ringer’s solution maintained at room temperature. One end of the muscle is fixed, and the other is connected to the transducer.
2. Equilibration: Allow the muscle to equilibrate in the tissue bath for about 30 minutes. Aerate the Ringer’s solution with oxygen throughout the experiment.
3. Baseline Recording: Record the baseline muscle tension without any acetylcholine to ensure stability and viability of the preparation.
4. Dose-Response Experiment:
Adding Acetylcholine: Start with the lowest concentration of acetylcholine and add it to the tissue bath. Allow the muscle to respond and record the contraction.
Washing: After recording the response, wash the muscle thoroughly with fresh Ringer’s solution to return to baseline tension.
Incremental Doses: Gradually increase the concentration of acetylcholine and repeat the recording and washing steps for each concentration. Ensure each dose elicits a clear response before proceeding to the next concentration.
5. Data Recording: Record the peak tension (force of contraction) for each acetylcholine concentration.
Calculations
Response Measurement: Measure the peak force of contraction for each dose of acetylcholine.
Normalized Response: Normalize the response data by setting the maximum response to 100% and expressing other responses as a percentage of the maximum.
Sample Data Table
| Acetylcholine Concentration (µM) | Peak Contraction (g) | Normalized Response (%) |
| 0.1 | 0.2 | 10 |
| 0.5 | 0.8 | 40 |
| 1.0 | 1.5 | 75 |
| 2.0 | 2.0 | 100 |
| 5.0 | 2.0 | 100 |
Plotting the Dose-Response Curve
1. Plot the normalized response (%) on the y-axis against the log of acetylcholine concentration (µM) on the x-axis.
2. Fit a sigmoidal curve to the data points using software such as GraphPad Prism or Excel.
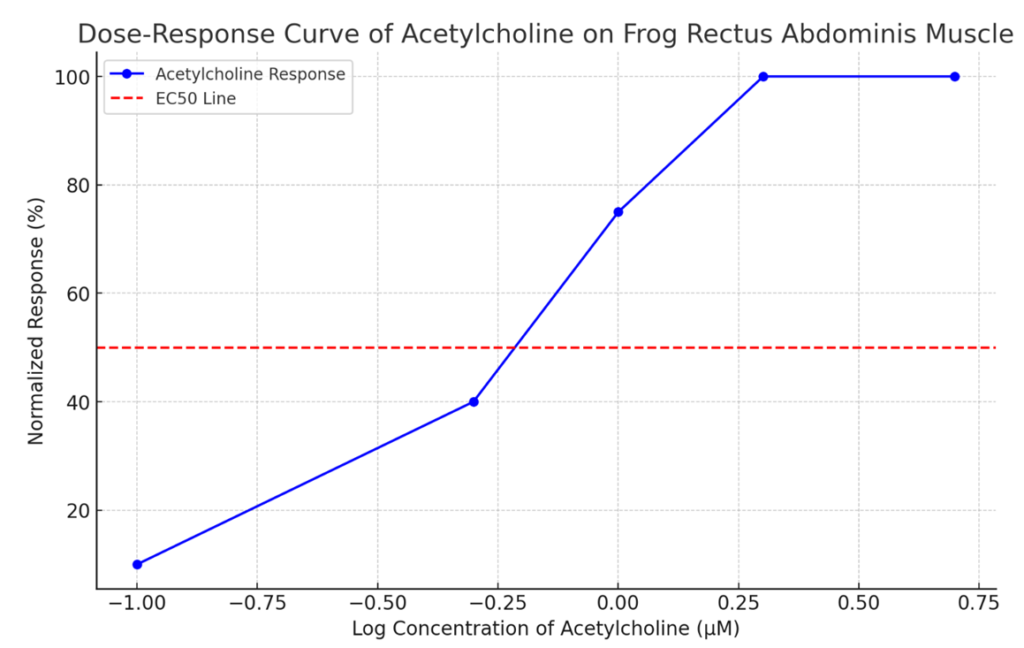
Here is the Dose-Response Curve of acetylcholine on the frog rectus abdominis muscle. The x-axis represents the log concentration of acetylcholine (in µM), and the y-axis shows the normalized response as a percentage of the maximum contraction. The red dashed line indicates the EC50 (the concentration at which 50% of the maximum response is observed). This graphical representation helps visualize the relationship between acetylcholine concentration and muscle contraction response.