

Electrocardiogram
An electrocardiogram, commonly referred to as an ECG or EKG (from the German “Elektrokardiogramm“), is a non-invasive medical test that records the electrical activity of the heart over a period of time. It is a vital tool for diagnosing and monitoring various heart conditions. Here’s a comprehensive overview of the ECG:

1. The Heart’s Electrical System
The human heart functions as a highly efficient pump, beating approximately 60 to 100 times per minute in a healthy adult at rest. This rhythmic and coordinated contraction of the heart muscle is controlled by a complex electrical conduction system, which ensures the timely contraction and relaxation of the four heart chambers. The primary function of this system is to generate and transmit electrical impulses that regulate the heartbeat, enabling the heart to supply oxygen-rich blood to the entire body.
Sinoatrial (SA) Node: The sinoatrial (SA) node is a specialized group of cells located in the upper wall of the right atrium, near the opening of the superior vena cava. It is often referred to as the natural pacemaker of the heart because it initiates the electrical impulses that set the heart rate.
- The SA node generates electrical signals spontaneously at regular intervals (typically 60–100 impulses per minute under normal conditions).
- These impulses spread rapidly through the walls of the right and left atria, triggering them to contract simultaneously.
- This contraction pushes blood from the atria into the ventricles.
Atria: Once the SA node fires, the electrical impulses spread through the atria, the upper chambers of the heart. This leads to:
- Atrial depolarization, which causes the atrial muscles to contract.
- The contraction forces blood into the ventricles, the lower chambers of the heart.
- This phase is represented by the P wave on an electrocardiogram (ECG or EKG).
Atrioventricular (AV) Node: Located at the junction between the atria and the ventricles, the atrioventricular (AV) node acts as a critical control point in the conduction pathway.
- The AV node receives the electrical impulse from the atria and delays it for a brief moment (about 0.1 seconds).
- This delay is crucial—it allows the ventricles time to fill with blood from the atria before they contract.
- Without this delay, the atria and ventricles would contract at the same time, reducing the heart’s efficiency.
Ventricles: After the AV node delay, the impulse moves to the Bundle of His, a group of specialized fibers located in the interventricular septum (the wall separating the two ventricles).
- The Bundle of His splits into right and left bundle branches, which travel down either side of the septum.
- These branches further divide into Purkinje fibers, a network of fibers that spread throughout the walls of the ventricles.
- The Purkinje fibers rapidly conduct the impulse to the ventricular muscle cells, triggering ventricular contraction.
This contraction:
- Pumps deoxygenated blood from the right ventricle into the pulmonary artery, sending it to the lungs for oxygenation.
- Pumps oxygenated blood from the left ventricle into the aorta, delivering it to the rest of the body.
- This phase is represented by the QRS complex on an ECG.
Repolarization – Preparing for the Next Beat
Once the contraction is complete, the heart muscle cells undergo a process called repolarization, during which they reset their electrical state in preparation for the next impulse.
- This phase is visible as the T wave on an ECG.
- Proper repolarization is essential to maintain a regular heart rhythm and prevent arrhythmias.
2. ECG Basics
An Electrocardiogram (ECG or EKG) is a simple, non-invasive test that provides a graphical representation of the heart’s electrical activity over time. It is one of the most commonly used diagnostic tools in cardiology and plays a crucial role in detecting heart conditions.
How It Works:
- The heart generates small electrical impulses with each beat, which spread through the heart muscle and trigger contractions.
- These electrical changes can be detected on the surface of the skin using specialized sensors known as electrodes.
Electrode Placement:
- Electrodes are placed on the skin at specific locations—typically on the chest, arms, and legs.
- These electrodes pick up the electrical signals produced by the heart.
- A standard ECG uses 12 leads to capture the heart’s activity from multiple angles.
Signal Recording and Output:
- The electrical signals detected by the electrodes are sent to the ECG machine.
- The machine amplifies these low-voltage signals and records them.
- The result is a visual trace of electrical activity, usually displayed as a series of waves on graph paper or digitally on a screen.
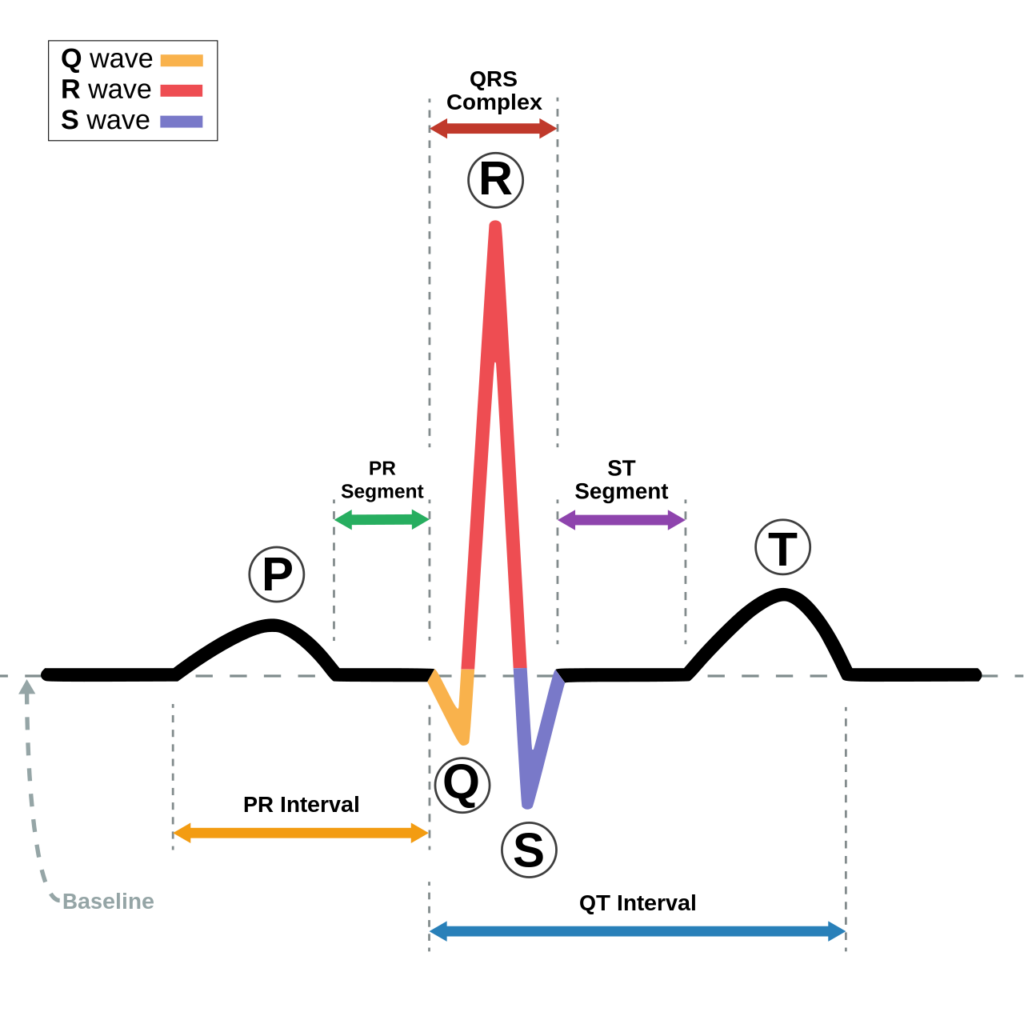
The ECG Tracing:
The visual output of an ECG typically includes:
P wave – Atrial depolarization (atrial contraction)
QRS complex – Ventricular depolarization (ventricular contraction)
T wave – Ventricular repolarization (ventricular relaxation)
Each wave and interval provides valuable information about the timing and coordination of the heart’s electrical signals, helping in diagnosing:
- Abnormal heart rhythms (arrhythmias)
- Myocardial infarction (heart attack)
- Conduction blocks
- Electrolyte imbalances
- Structural problems such as hypertrophy
3. ECG Waveforms
The ECG provides valuable information about the heart’s electrical activity, which is represented by various waveforms:
P Wave:
- The P wave represents the depolarization of the atria, which initiates atrial contraction.
- This electrical activity begins at the sinoatrial (SA) node, the heart’s natural pacemaker.
- A normal P wave is small, smooth, and rounded.
- Abnormalities in the P wave can indicate atrial enlargement, atrial fibrillation, or other atrial disorders.
QRS Complex:
- The QRS complex reflects the rapid depolarization of the ventricles, leading to ventricular contraction.
- It follows a brief delay at the atrioventricular (AV) node, which allows time for the ventricles to fill with blood from the atria.
- A normal QRS complex is sharp and narrow, typically lasting less than 0.12 seconds.
- A wide or abnormally shaped QRS can suggest bundle branch blocks, ventricular hypertrophy, or premature ventricular contractions.
T Wave:
- The T wave represents the repolarization (recovery) of the ventricles.
- This is the period when the ventricles reset electrically and prepare for the next contraction.
- The T wave is usually upright and smooth in most ECG leads.
- Inverted, flattened, or peaked T waves can indicate ischemia, electrolyte imbalances (like potassium), or myocardial infarction.
ST Segment:
- The ST segment connects the end of the QRS complex to the beginning of the T wave.
- It represents the period between ventricular depolarization and repolarization, when the ventricles are fully contracted.
- The ST segment is especially important in diagnosing heart attacks (myocardial infarction).
- Elevation of the ST segment may indicate acute myocardial infarction (STEMI).
- Depression may suggest myocardial ischemia or non-ST elevation myocardial infarction (NSTEMI).
| Waveform | Represents | Clinical Relevance |
|---|---|---|
| P Wave | Atrial depolarization | Atrial rhythm and structure |
| QRS Complex | Ventricular depolarization | Ventricular rhythm, conduction pathways |
| T Wave | Ventricular repolarization | Recovery phase; indicates ischemia or electrolyte imbalances |
| ST Segment | Ventricular contraction phase | Crucial in diagnosing myocardial infarction |
4. Diagnostic Capabilities
ECGs are used for various purposes, including:
Diagnosing Arrhythmias: An irregular pattern in the ECG can signal the presence of arrhythmias, which are abnormal heart rhythms.
Assessing Heart Damage: Changes in the ST segment can reveal myocardial ischemia or infarction, indicating heart damage.
Evaluating Heart Enlargement: An enlarged heart may produce characteristic ECG changes.
Monitoring Cardiac Health: Healthcare providers use ECGs to monitor patients with heart conditions and those at risk of cardiac problems.
5. Types of ECGs
Resting ECG: performed while the patient is at rest, typically lying down. It’s the most common type of ECG and serves as a baseline for heart health.
Exercise Stress Test: Record the ECG while the patient exercises on a treadmill or stationary bike to assess heart function during physical stress.
Holter Monitor: Wear this portable ECG device for an extended period, typically 24-48 hours, to record heart activity during daily activities.
6. Clinical Significance
ECGs are a vital tool for diagnosing and monitoring heart conditions. In emergency situations, healthcare professionals often use them to evaluate chest pain, shortness of breath, or palpitations, and they play a significant role in routine cardiac examinations.