

A growth curve is a graphical representation of the changes in the population of microorganisms over time under specific growth conditions. The curve typically illustrates the different phases of microbial growth, providing insights into the growth dynamics of a population. The growth curve is a standard tool in microbiology and is often used to understand and optimize culture conditions. The curve generally consists of four main phases:
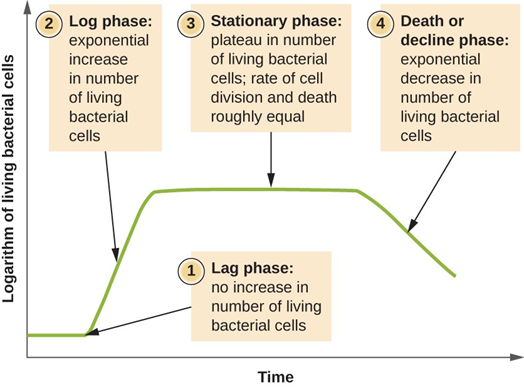
1. Lag Phase
In the lag phase, there is little to no increase in microorganisms.
Cells adjust to their new environment, synthesize enzymes, and prepare for rapid growth.
The duration of the lag phase varies depending on the culture conditions, the inoculum’s health, and the microorganisms’ characteristics.
2. Logarithmic (Log or Exponential) Phase
In the log phase, also known as the exponential phase, the population grows at a constant and maximum rate.
Microorganisms are actively dividing and synthesizing cellular components.
The growth is usually represented by a straight line on a logarithmic scale, indicating exponential growth.
3. Stationary Phase
In the stationary phase, the growth rate slows, and the number of dying cells balances the number of new cells.
Nutrient depletion, waste accumulation, and other environmental factors contribute to the cessation of exponential growth.
The population size remains relatively constant during this phase.
4. Death (Decline or Logarithmic Decay) Phase
In the death phase, the number of viable cells decreases.
Conditions become unfavorable for growth due to the depletion of essential nutrients, accumulation of toxic by-products, or other factors.
The decline may be gradual or steep, leading to a decline in the overall population.
Understanding the growth curve is essential for various applications, including industrial fermentation, pharmaceutical production, and research. Researchers use growth curves to optimize culture conditions, estimate growth rates, and study the effects of environmental factors on microbial populations. The specific characteristics of the growth curve can vary based on the microbial species, the composition of the culture medium, and the environmental conditions provided during the experiment.