

UV-Visible Spectroscopy, also known as Ultraviolet-Visible Spectroscopy, is an analytical technique used to measure the absorbance or reflectance of ultraviolet (UV) and visible light by a substance, primarily employed for determining the concentration and characteristics of compounds in solution.
This technique operates within specific wavelength ranges, covering the ultraviolet region (approximately 200-400 nm) and the visible region (approximately 400-700 nm) of the electromagnetic spectrum.
Absorbance (A) and transmittance (T) are fundamental concepts in UV-visible spectroscopy. Absorbance measures the amount of light absorbed by a sample, while transmittance quantifies the fraction of light passing through the sample. The equation relates these quantities A = -log(T), providing a means to assess light absorption.
The Beer-Lambert Law is pivotal in UV-visible spectroscopy, establishing a relationship between the absorbance of a sample and its concentration (c), the path length of the light through the sample (l), and the molar absorptivity (ε), which is a characteristic property of the substance being analyzed. The equation A = εlc enables the determination of analyte concentration in solution, which is crucial for quantitative analysis.
Principle of UV-visible spectroscopy
The principle of UV-visible spectroscopy revolves around the interaction of electromagnetic radiation in the ultraviolet (UV) and visible regions with matter, particularly molecules. When light of specific wavelengths within the UV and visible spectrum passes through a sample, it interacts with the molecular components of the sample. The principle encompasses several key aspects:
1. Electromagnetic Radiation: UV-visible spectroscopy involves using electromagnetic radiation in the UV and visible regions of the spectrum. This radiation consists of photons, which are packets of energy. Different wavelengths of light correspond to different energies of photons.
2. Electronic Transitions: Molecules possess electrons that can exist at different energy levels within the molecular orbitals. When electromagnetic radiation interacts with a molecule, it can promote electrons from lower energy levels to higher ones. The energy required for this transition corresponds to the energy of the incident photons. This process is known as electronic excitation.
3. Absorption of Light: The energy of the incident photons must match the energy required for electronic excitation in the molecule. If the energy of the incident light does not match the energy required for electronic transition, no absorption occurs. However, if the energy matches, the molecule absorbs the light at specific wavelengths, decreasing the intensity of transmitted light.
4. Absorbance and Transmittance: UV-visible spectroscopy quantifies the absorption of light by a sample. Absorbance (A) measures the amount of light absorbed by the sample, while transmittance (T) quantifies the fraction of incident light that passes through the sample without being absorbed. These two parameters are related by the equation \(A = -\log(T)\).
5. Beer-Lambert Law: This law describes the relationship between absorbance, the concentration of the absorbing species, the path length of the light through the sample, and the molar absorptivity (extinction coefficient) of the substance. The Beer-Lambert Law equation is A = εlc, where (A) is absorbance, (ε) is the molar absorptivity, (𝑙) is the path length of the sample, and (c) is the concentration of the absorbing species. This law allows for the quantification of analyte concentration in a sample.
6. Spectrophotometry: UV-visible spectroscopy relies on spectrophotometric measurements to determine a sample’s light absorbance across a range of wavelengths. A spectrophotometer measures the intensity of transmitted light through a sample and compares it to the intensity of incident light.
Laws of UV visible spectroscopy
UV-Visible Spectroscopy operates under several fundamental laws and principles that govern the interaction of electromagnetic radiation with matter and absorbance measurement. Here’s a detailed overview of the key laws involved:
1. Beer-Lambert Law: The Beer-Lambert Law describes the relationship between the absorbance of light by a solution and the concentration of the absorbing species, the path length of the sample, and the molar absorptivity of the substance.
Mathematically, the Beer-Lambert Law is expressed as:
A = ε⋅l⋅c
Where:
(A) is the absorbance of the sample.
(ε) (epsilon) is the molar absorptivity, a constant characteristic of the absorbing substance and the specific wavelength of light.
(l) is the path length of the sample, typically measured in centimetres.
(c) is the concentration of the absorbing species, usually expressed in molarity (mol/L).
This law is fundamental for quantitative analysis in UV-visible spectroscopy. It allows for the determination of unknown concentrations by comparing absorbance values to a calibration curve.
2. Lambert’s Law: Lambert’s Law, a special case of the Beer-Lambert Law, applies when the concentration of the absorbing species is very low and the path length of the sample is constant.
Mathematically, Lambert’s Law is expressed as:
A = ε⋅c⋅l
This law emphasizes that absorbance is directly proportional to concentration and path length under ideal conditions.
3. Absorption Spectrum:
The absorption spectrum is a graphical representation of the absorbance of light by a substance as a function of wavelength. The spectrum typically shows peaks and troughs corresponding to wavelengths of light absorbed by the sample. The position and intensity of these peaks provide information about the sample’s electronic structure and molecular composition.
4. Transmission and Absorbance:
UV-visible spectroscopy measures the transmission of light through a sample and relates it to absorbance using the relationship:
A = -log (T)
Where:
(A) is the absorbance.
(T) is the transmittance, the fraction of incident light that passes through the sample.
This relationship allows for the quantification of absorbance based on the fraction of light transmitted through the sample.
5. Quantum Mechanical Principles:
UV-Visible Spectroscopy is based on quantum mechanical principles that describe the behaviour of electrons within molecules.
Electronic transitions between energy levels within the molecular orbitals are responsible for light absorption at specific wavelengths.
The energy required for these transitions corresponds to the energy of photons in the UV-visible range, leading to characteristic absorption spectra.
6. Stokes’ Law:
Stokes’ Law describes the relationship between the intensity of transmitted light and the concentration of the absorbing species in a solution.
It states that the rate of decrease in intensity (change in absorbance) is directly proportional to the concentration of the absorbing species.
Stokes’ Law is particularly relevant for kinetic studies, where changes in absorbance over time are monitored to determine reaction rates.
Instrumentation of UV-Visible Spectroscopy
UV-visible spectroscopy utilizes sophisticated instrumentation to measure a sample’s absorbance of light across the ultraviolet (UV) and visible regions of the electromagnetic spectrum.
1. Light Source: UV-Visible spectrophotometers typically incorporate two light sources: a deuterium lamp for the UV range and a tungsten filament lamp for the visible range. These lamps provide a continuous spectrum of light covering the entire UV and visible regions.
2. Monochromator: The monochromator is a crucial component that selects a narrow range of wavelengths from the broad spectrum emitted by the light source. It disperses the incoming light into its component wavelengths and allows only the desired wavelength to pass through to the sample.
Typically, the monochromator consists of a prism or diffraction grating, which separates the light into its constituent wavelengths. By rotating the grating or prism, different wavelengths can be selected.
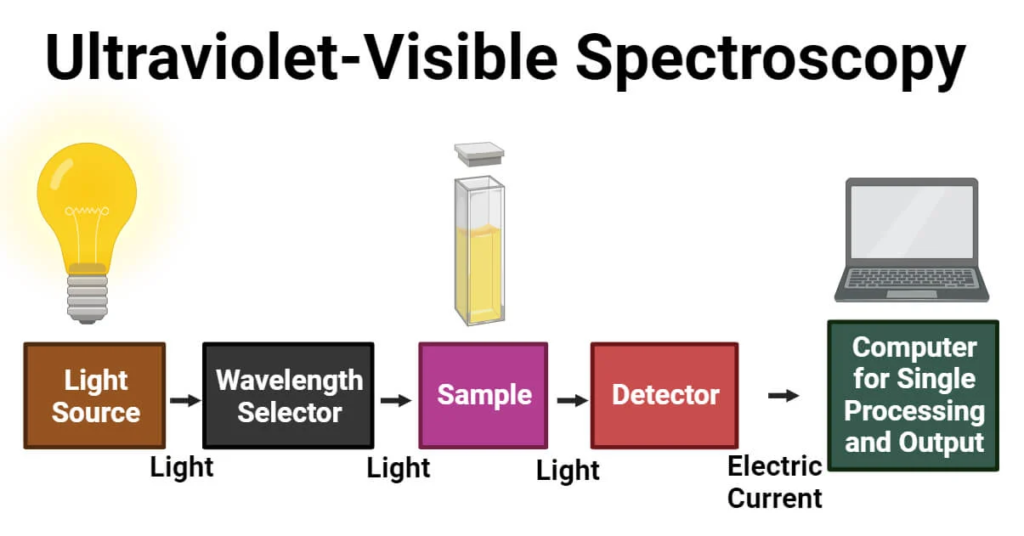
3. Sample Compartment: This is the region where the sample is placed for analysis. It usually consists of a sample holder, commonly a quartz or glass cuvette, which holds the sample solution.
The sample compartment is designed to ensure uniform illumination of the sample by the selected wavelength of light.
4. Detector: The detector measures the intensity of light transmitted through the sample across the selected wavelength range. It converts the light signal into an electrical signal that can be processed and analyzed.
Common detectors include photomultiplier tubes (PMTs) and charge-coupled devices (CCDs). PMTs are sensitive and provide high signal-to-noise ratios, while CCDs offer the advantage of simultaneous detection over a range of wavelengths.
5. Data Processing and Display: UV-visible spectrophotometers are equipped with data processing units that analyze the signals from the detector. This process involves converting the electrical signals into absorbance values using appropriate calibration.
The results are typically displayed on a digital screen, where absorbance spectra or concentration measurements can be viewed. Some instruments also allow for data export and further analysis on external devices.
Applications of UV-Visible Spectroscopy
UV-Visible Spectroscopy finds extensive applications across various scientific fields due to its versatility and sensitivity. Here’s an overview of some common applications:
1. Quantitative Analysis: UV-visible spectroscopy is widely used for quantitative analysis of substances in solution. A calibration curve can be generated by measuring the absorbance of known concentrations of a substance at specific wavelengths, allowing for the determination of unknown concentrations in samples.
2. Qualitative Analysis: UV-visible spectroscopy is employed for qualitative analysis to identify substances based on their absorbance spectra. Each compound exhibits characteristic absorption patterns, allowing for the identification of unknown substances or the confirmation of the presence of specific functional groups.
3. Determining Concentration: UV-visible spectroscopy is utilized to determine the concentration of analytes in solution. The Beer-Lambert Law relates absorbance to concentration, allowing for precise quantification of solutes in samples. This is particularly useful in pharmaceutical, environmental, and biochemical analyses.
4. Kinetics Studies: UV-visible spectroscopy is used to study reaction kinetics by monitoring changes in absorbance over time. The reaction rate can be determined by measuring the change in absorbance as reactants are consumed or products are formed.
5. Purity Analysis: UV-visible spectroscopy is employed to assess the purity of compounds by analyzing their absorbance spectra. Impurities can often be detected by characteristic changes in the spectrum, such as additional absorption peaks or shifts in peak positions.
6. Protein and Nucleic Acid Analysis: UV-visible spectroscopy is commonly used in biochemistry to quantify proteins and nucleic acids, such as DNA and RNA. Proteins and nucleic acids absorb UV light due to the presence of aromatic amino acids and nucleotide bases, respectively. This enables accurate quantification and purity assessment of biomolecules.
7. Environmental Analysis: UV-visible spectroscopy is utilized in environmental monitoring to analyze pollutants and contaminants in air, water, and soil samples. It allows for detecting and quantifying various environmental pollutants, including heavy metals, pesticides, and organic pollutants.
8. Pharmaceutical Analysis: UV-visible spectroscopy is employed in pharmaceutical industries to control the quality of raw materials, intermediate products, and finished pharmaceutical formulations. It is used to quantify active pharmaceutical ingredients, assess stability, and monitor degradation products.
9. Material Science: UV-Visible Spectroscopy is used in materials science to study the optical properties of materials such as semiconductors, nanoparticles, and polymers. It provides valuable information about band gaps, electronic transitions, and optical absorption characteristics.
10. Food and Beverage Analysis: UV-visible spectroscopy is utilized in the food and beverage industry for quality control, authenticity testing, and analysis of nutritional components. It can also determine the concentration of vitamins, pigments, and additives in food products.
Visit to: Pharmacareerinsider.com